
Different Weather Patterns due to tilt in Earth’s Axis
Ahmed Attia, Alejandro Mendez, Yoselin Sanchez
The City College Of New York
April, 16th, 2024
Abstract
The intricate dynamics of Earth’s axial tilt and its impact on sunlight dispersion across latitudes, present’s significant environmental and societal challenges today. While the proximity to the Sun influences temperature variations, the Earth’s elliptical orbit introduces an entirely new level of complexity. This experiment, employing a flashlight and graph paper, simulated sunlight dispersion at different angles to elucidate these phenomena. The Findings revealed varying sunlight exposure corresponding to tilt angles, with implications for seasonal fluctuations. Presenting data in square-foot terms highlighted how sunlight diminishes with the Earth’s rotation, accentuated by seasonal changes. Understanding these dynamics is also crucial for addressing the environmental, societal, and economic challenges we face today.
Introduction
The majority of people on Earth experience hot summers with many hours of intense sunlight and chilly winters brought on by fewer daylight hours and feeble sunlight. The intense summer heat and the bitter winter cold are related to the Earth’s proximity to the Sun, but in reality, the Earth’s orbit is nearly round, resembling more of an ellipse; this means that the change in the Earth’s distance from the Sun is a factor all year long.
This report delves into the intricate dynamics of Earth’s axial tilt (23.5 degrees) and its influence on the dispersion of sunlight, ultimately shaping seasonal variations across different latitudes as observed throughout the year. Previous research has been able to establish the relationship between axial tilt and seasonal changes, and in this lab report, we have been able to verify the findings of those experiments and validate them. However, uncertainties remain regarding how sunlight impacts specific regions based on tilt and orientation, necessitating further investigation. This is because no simple experiment can highlight the full scope of the topic as of yet.
Some adults and young kids believe that the seasons are caused by how close the earth is to the sun, which is not true (Lambert). This belief was caused by devices that create heat for people, considering how someone can get close to the heater and get more heat while farther away will only decrease the heat (Lambert). Hence some people depict the same logic with the sun correlating with the seasons. When the sun is beaming on the earth, some parts of the Earth are warmer, these very warm places are found in the equator. Meanwhile, in the northern and southern hemispheres there is a significant amount of sunlight being provided but not as much as the equator, which contributes to the earth’s tilted axis (Klepis). Having the earth’s axis point to the sun makes that part of the hemisphere receive more sunlight which is more likely to be summer. Meanwhile when the earth’s axis is pointed away from the sun then this leads to more winter temperatures (US Department of Commerce).The goal of this report will be to test and hopefully prove our hypothesis that the earth’s axial tilt is in fact the key factor involved in variations of sunlight dispersion around the year, and invalidate the claims that it is mainly caused by proximity to the sun.
Methods & Materials
For this experiment, it was aimed to investigate the impact of Earth’s axial tilt on sunlight dispersion using a simple yet effective methodology. The materials utilized included a flashlight, three pieces of graph paper, a protractor, and a book. The experimental setup involved placing the flashlight on a stable surface, such as a box, to represent the “sun.” Then the graph was taped to the paper onto the book, positioning it vertically to serve as the surface for measuring sunlight dispersion. The flashlight was adjusted until a 5 cm wide circle of light was projected onto the graph paper. The number of boxes illuminated inside this circle was counted as the measure of sunlight exposure.
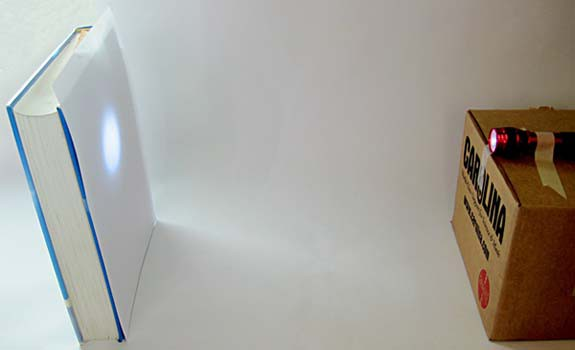
(Image of experiment after it is fully set up and in the 0% angle)
To simulate the effect of varying tilt angles, the graphing paper was tilted to increments of 10 degrees using the protractor, starting from 0 degrees and increasing to 40 degrees. At each tilt angle, the number of illuminated boxes inside the circle was recorded. This process was repeated for replication, ensuring the reliability of the data.
For data analysis, basic statistical techniques were employed to analyze the results. Specifically, the calculated mean and standard deviation of the number of illuminated boxes at each tilt angle to understand the central tendency and variability of the data. Followed by conducting a one-way analysis of variance (ANOVA) to determine if there were significant differences in sunlight exposure across different tilt angles. Additionally, this assessment had to be checked for the normality of the data using Shapiro-Wilk tests. A significance level (α) of 0.05 was set for all statistical tests. Overall, the experimental design and data analysis allowed for the exploration of the relationship between Earth’s axial tilt and sunlight dispersion effectively.
Results
Table 1: Angle of Earth vs Number of lighted squares
| Degrees of Tilt | Graph 1 | Graph 2 | Graph 3 | The average number of squares |
| 0 degrees | 95 | 93 | 97 | 95 |
| 10 degrees | 124 | 122 | 126 | 124 |
| 20 degrees | 134 | 132 | 136 | 134 |
| 30 degrees | 142 | 140 | 144 | 142 |
| 40 degrees | 170 | 168 | 172 | 170 |
The results of the experiment revealed a clear relationship between the tilt angle of the graph paper and the number of illuminated boxes within the 5 cm wide circle of light. At 0 degrees tilt, 95 boxes were illuminated, indicating a baseline level of sunlight exposure. As the tilt angle increased, the number of illuminated boxes also increased: at 10 degrees, 124 boxes were illuminated; at 20 degrees, 134 boxes; at 30 degrees, 142 boxes; and at 40 degrees, 170 boxes were illuminated, demonstrating a progressive enhancement in sunlight dispersion with greater tilt angles.
For the second test run, the results exhibited similar trends but with slight variations in the number of illuminated boxes. At 0 degrees tilt, 93 boxes were illuminated; at 10 degrees, 122 boxes; at 20 degrees, 132 boxes; at 30 degrees, 140 boxes; and at 40 degrees, 168 boxes were illuminated.
In the third test run, again, a consistent trend in sunlight dispersion was observed, albeit with minor fluctuations in the number of illuminated boxes. At 0 degrees tilt, 97 boxes were illuminated; at 10 degrees, 126 boxes; at 20 degrees, 136 boxes; at 30 degrees, 144 boxes; and at 40 degrees, 172 boxes were illuminated.
These results corroborate the hypothesis that increasing tilt angles lead to greater sunlight exposure, underscoring the importance of Earth’s axial tilt in shaping seasonal variations in sunlight dispersion.
Discussion
This experiment provided valuable insights into the intricate dynamics of Earth’s axial tilt and its impact on sunlight dispersion, elucidating the phenomenon of seasonal variations across latitudes. The hypothesis regarding the relationship between tilt angles and sunlight exposure was supported by the observed increase in illuminated boxes as tilt angles increased. These findings align with existing research that establishes a correlation between axial tilt and seasonal changes, reaffirming the significance of this phenomenon.
While the experiment successfully demonstrated the influence of tilt angles on sunlight dispersion, several limitations merit consideration. The simplicity of the experimental setup may have oversimplified the complexities of Earth’s atmosphere and geographic features, potentially affecting the accuracy of collected results. Additionally, the small scale of the simulation may not fully capture the nuances of sunlight dispersion at larger spatial scales.
Looking ahead, future research could explore more sophisticated experimental setups or employ computational models to simulate sunlight dispersion across different latitudes and seasons more accurately. Investigating the interplay between Earth’s axial tilt, atmospheric conditions, and geographic features could further enhance our understanding of seasonal variations and their implications for climate and weather patterns.
Previous research has shown that other planets such as Mars have different seasonal changes due to its tilt in axis caused by gravitational disturbances from neighboring planets. As time passes, small gravitational disturbances from planets that are close to one another start to become unstable, causing a problem with the fluctuation in the orbit and orientation of the planet. The effect of the gravitational disturbances has been affecting Mars which explains the countless weather patterns the planet experiences. This matter isn’t something found on Earth to be worried about because the moon helps stabilize the gravitational pull of nearby planets, which leads to the seasons. This information contributes to the project by comparing Mars to Earth based on the different weather patterns both planets have based on the tilt in the axis.
In summary, this study contributes to the ongoing discourse on Earth’s axial tilt and seasonal fluctuations, highlighting the need for continued exploration and refinement of our understanding of this complex phenomenon. By addressing these questions and pushing the boundaries of scientific inquiry, it is better to comprehend the intricacies of Earth’s climate system and inform strategies for mitigating the environmental and societal impacts of seasonal variations.
Annotated Bibliography:
De Paor, D. G., Dordevic, M. M., Karabinos, P., Burgin, S., Coba, F., & Whitmeyer, S. J. (2017). Exploring the reasons for the seasons using Google Earth, 3D models, and plots. International Journal of Digital Earth, 10(6), 582–603. https://doi.org/10.1080/17538947.2016.1239770
Klepeis, A. (2020). The sun and the weather. Cavendish Square Publishing, LLC.
Lambert, J. L., & Sundburg, S. S. (2010). The reasons for the seasons.(Science Shorts: Classic classroom activities that emphasize science-process skills). Science and Children, 47(8), 68–68.
NASA. (2021, July 22). What causes the seasons?. NASA. https://spaceplace.nasa.gov/seasons/en/
US Department of Commerce, N. (2024, February 29). Why do we have seasons?. National Weather Service. https://www.weather.gov/lmk/seasons#:~:text=The%20earth’s%20spin%20axis%20is,away%2C%20winter%20can%20be%20expected.
Wilford, J. N. (1993, March 2). Moon May Save Earth From Chaotic Tilting of Other Planets. The New York Times, Inc.. Retrieved January 7, 2009.