
Different Weather Patterns due to tilt in Earth’s Axis
Institution:The City College of New York
Scientists: Alejandro, Ahmed, Dewayne, Yoselin
Proposal date: March 26, 2024
Proposed Budget: $55.00
Abstract
The Earth’s orbit around the sun is an ellipse, constantly revolving around the sun, Coupled with the fact that the earth remains on a constant tilt. This creates different points in the observable year where there is a small difference in the distance from the sun to the earth (Strong 2000), creating the observable seasons. The main objective of this research is to examine the scientific reasons for the seasons and how they correlate to the effect of light on a surface and how that translates to the surface of Earth. This proposal center’s around trying to recreate a small-scale model version of the sun and our earth using effective yet simple substitutes for our solar system, the chosen materials include a flashlight meant to replicate our sun, and a sheet of graphing paper that will be illuminated in the shape of a sphere with a diameter of 5cm which replicates our sun. The expected relevance of the tilt will be tested by gradually increasing the degree of the graphing paper at the original distance to observe if there is any change. The experiment will be replicated twice more afterwards to ensure we get accurate results that fall within a standard deviation of error. Our hypothesis is that as the tilt of the paper increases so will the number of squares illuminated by the flashlight thereby confirming the importance of our planet’s tilt in correlation to seasonal variations.
Introduction
The goal of this experiment is to further our knowledge of how and why our seasons occur, and to dismiss any false information about what causes our observable seasons. As mentioned prior the goal is to dismiss false information, or incorrect assumptions that may be made about what causes the seasons we observe as it is important that we test and confirm our theories rather than assume they are correct, and spread false information. This experiment will therefore attempt to fully confirm that the earth’s axial tilt is in fact the driving factor that causes our seasonal changes, rather than the popular belief by many that it is in fact our distance from the sun that fully dictates our seasons.
Literature Review
The following articles focus on the causes that contribute to the change in the seasons. The first article, Moon May Save Earth From the Chaotic Tilting of Other Planets, written by John Noble Wilford, who supports the idea that the moon’s gravitational pull is the reason for the earth’s tilts. Moreover, portraying the role the moon plays in the season is important since, with each gravitational pull, the earth’s axis tilts an angle, impacting how much sunlight is received, and as the moon moves away from Earth, its tilt also changes over time. As stated, “the Moon exerts enough gravitational pull not only to move the oceans in tides but also to provide a restraining torque on the planet’s propensity to tilt.One might consider the Moon to act as a potential climate regulator for the Earth” (Wildford 1993). Thus, the moon prevents Earth from undergoing harsh tilt changes due to the moon acting as its stabilizer. However, even though no further evidence was found in this research, it was said to be a gateway to further exploring the evolution of the solar system and learning about other planetary systems.
The second article, The Reasons for the Seasons, written by Kristin Strong, also supports the idea of the moon’s gravitational pull affecting the climate on earth. In this research, the main focus was to examine how the tilt of a surface affects how light hits the surface. As stated, “When it is summer in North America, the top part of the axis points in the direction of the sun, and the sun’s rays shine directly on North America; while in South America, the axis is tipped away from the sun, and the sun’s rays hit Earth on a slant. So, when it is summer in North America, it is winter in South America. As for the intermediate seasons, spring and fall, these are seasons when neither the top nor the bottom of Earth’s axis are pointed in the direction of the sun” (Strong 2000). In other words, the changes in the seasons are due to the tilts of the earth caused by the moon’s gravitational pulls.
On the other hand, the third article, The Reasons for the Seasons: Using Temperature Data to Challenge Students’ Misconceptions written by Jeffrey D. Thomas used a different approach; instead of focusing on what causes the changes in seasons, the research focused on students reviewing temperature data to identify possible factors that might cause the changes in seasons. The temperature data used showed further evidence proving the distance from the sun is a reason for the seasons. In the same vein, some students also found Earth’s tilt on its axis to be another reason. As stated, “many students correctly and thoroughly explain that the tilt of the earth as it revolves around the sun is the primary reason for the seasons. Although some naive conceptions about the seasons remain, student understanding shows significant improvement after completing this unit” (Thomas 2011). Even though this research used a different approach, it showed that using collected data on the patterns of temperature can also be a possible way to calculate the reasons for the change in the season. Overall, these articles support the search regarding the changes in reasons and their possible causes. Our research is focused on the reasons for the seasons, specifically how the moon’s impact on Earth’s tilts changes the amount of light reflected on Earth.
Project Narrative
The experiment to be conducted involves a simple yet effective setup, requiring the following materials: a flashlight, three pieces of graph paper, a cardboard box or a piece of wood, tape, and a protractor. The cardboard box serves as a stable platform for the flashlight, symbolizing the “sun,” and is securely taped down to prevent inadvertent changes in the direction of the light. A book or piece of wood, roughly the size of the graph paper, is then taped together and positioned vertically at a 0-degree angle, serving as the reference point or origin. Upon turning on the flashlight, its distance is gradually adjusted until the light projection forms a circumference of 5–6 cm, effectively mimicking a scaled-down representation of the Earth. Subsequently, the experiment commences by tracing the circle illuminated by the flashlight. The angle of the paper is then systematically adjusted using a protractor at intervals of 10 degrees (0, 10, 20, 30, 40), with each light projection traced in different colors to enhance visibility. Representing the amount of the earth illuminated or heated by the sun as referenced in the intro. Once all the information is collected the experiment will be done twice more to increase accuracy, and once all the experiments have been run, the data will be graphed. Once collected the information can be modified into digestible bites of information illustrating the correlation between the squares on the graphing paper and the surface of the earth.
Personnel
This project was completed by freshmen from City College who aspire to become engineers, architects, or mathematicians. We collaborated with each other plenty of times to make this project the best, most organized, and most understood topic where anyone can read about the seasons on planet Earth.
In the introduction part of the project, Dwayne was responsible for introducing the topic of the seasons, demonstrating to the reader what this project will be based on and how it relates to the world in some way that the reader can gain information about.
In the abstract part of the project, Yoselin was responsible for explaining how the experiment was done and what materials to use for this project. Not to mention that she was also explaining the steps in this project, and how it functions.
In the project narrative, Ahmed was responsible for explaining how the project relates to the real world. Ahmed explains the correlation between the materials that are being used in this project and connecting each material to its respective part of the world. Ahmed also handled the budget section of the project and organized it properly.
In the annotated bibliography, Alejandro had to explain the sources that were used for this project and how they related to the project. Alejandro had to mention each of the websites and provide a small paragraph on the use of each website.
Budget
| Item | Name | Quantity | Cost |
| Flashlight | DEWALT 20V | 1 | $39.00 |
| Cardboard box | ….. | 1 | $0.00 |
| Graph paper | Oxford filler paper | 1 (10) in a pack | $10.82 |
| Protractor | Wescott | 1 | $1.29 |
| Total | —- | 4 | $55.00 |
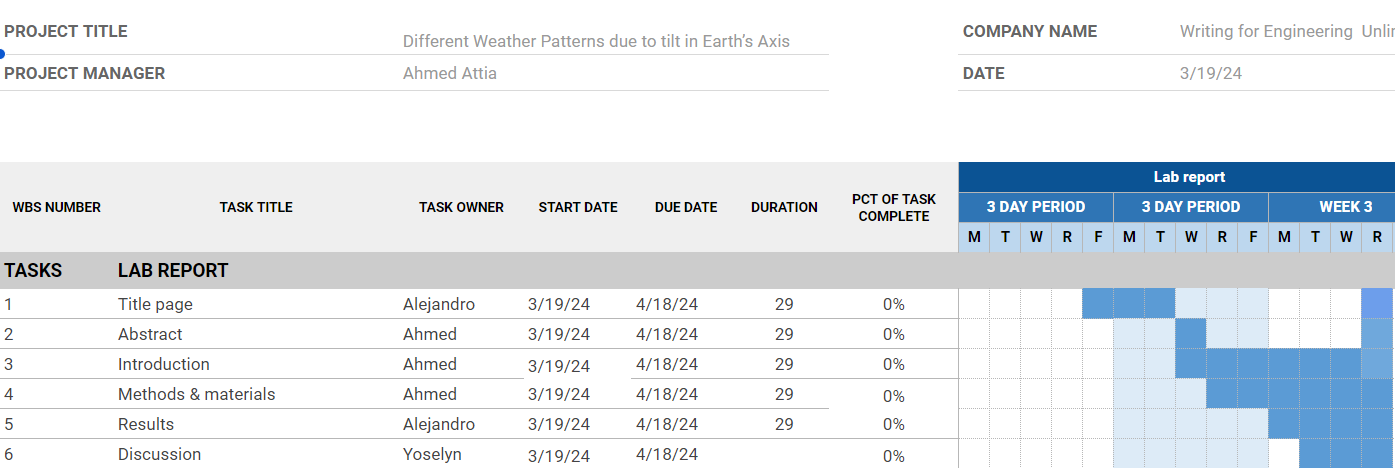
Timeframe
Bibliography
Berger, A., & Loutre, M. F. (1991). Graph of the tilt of the Earth’s axis. Retrieved January 9, 2009.
De Paor, D. G., Dordevic, M. M., Karabinos, P., Burgin, S., Coba, F., & Whitmeyer, S. J. (2017). Exploring the reasons for the seasons using Google Earth, 3D models, and plots. International Journal of Digital Earth, 10(6), 582–603. https://doi.org/10.1080/17538947.2016.1239770
Entwisle, T. J. (2014). Sprinter and sprummer: Australia’s changing seasons. CSIRO Publishing.
Klepeis, A. (2020). The sun and the weather. Cavendish Square Publishing, LLC.
Lambert, J. L., & Sundburg, S. S. (2010). The reasons for the seasons. Science and Children, 47(8), 68–68.
National Center for Education Statistics. (n.d.). Create a Graph. Retrieved June 25, 2020.
Wilford, J. N. (1993, March 2). Moon May Save Earth From Chaotic Tilting of Other Planets. The New York Times, Inc.. Retrieved January 7, 2009.